How to Create a Report with Cross Tabs
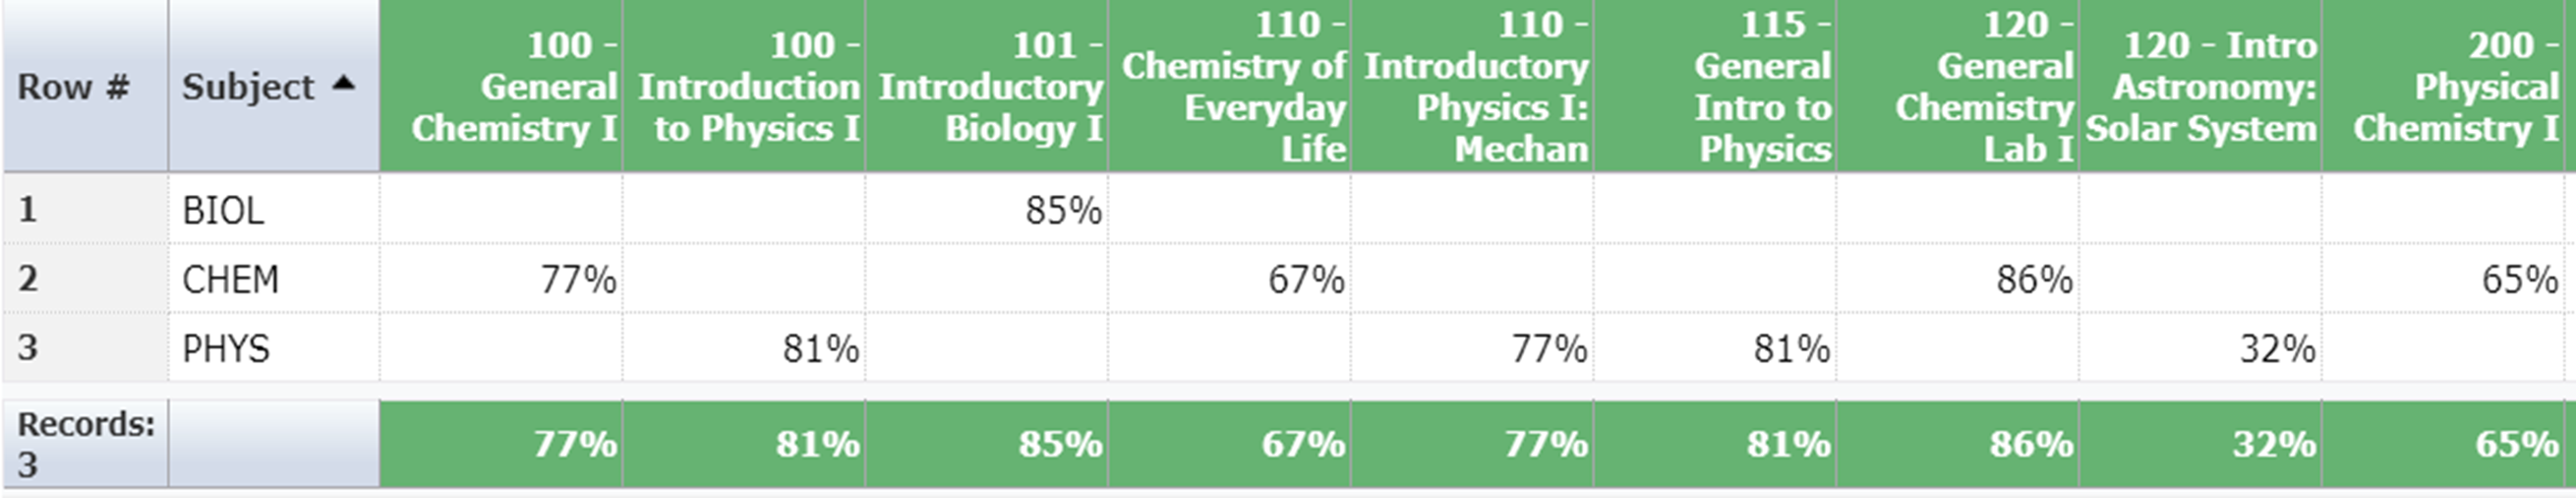
The Advanced Options Cross Tab option allows you to create a summary table of data using cross tabulation. In this example, the report will summarize the total month actuals for each Fund/Orgn/Acct in each fiscal period and present it in a data grid.
To Create a report using Cross Tabs
The report must have been created with Cross Tab enabled.
Go to the Reporting Page for the report you wish to use. Select Advanced Options.
Using the Cross Tab header, select the following:
Cross Tab column headings
Populate with (which column data)
Calculate as
Formatting and column Alignment and width

Select the field that you wish to use as a column heading for the tabulation from the Create Column Headings From drop down List
Select the data that you want to tabulate from the Populate With drop down list
Select the calculation required from the Calculate as drop down list
Select the desired column formatting (e.g. Currency, 2 Decimals, $)
Select the desired column alignment (e.g. Left, Right, Centre)
Select the column default width (e.g. 75)
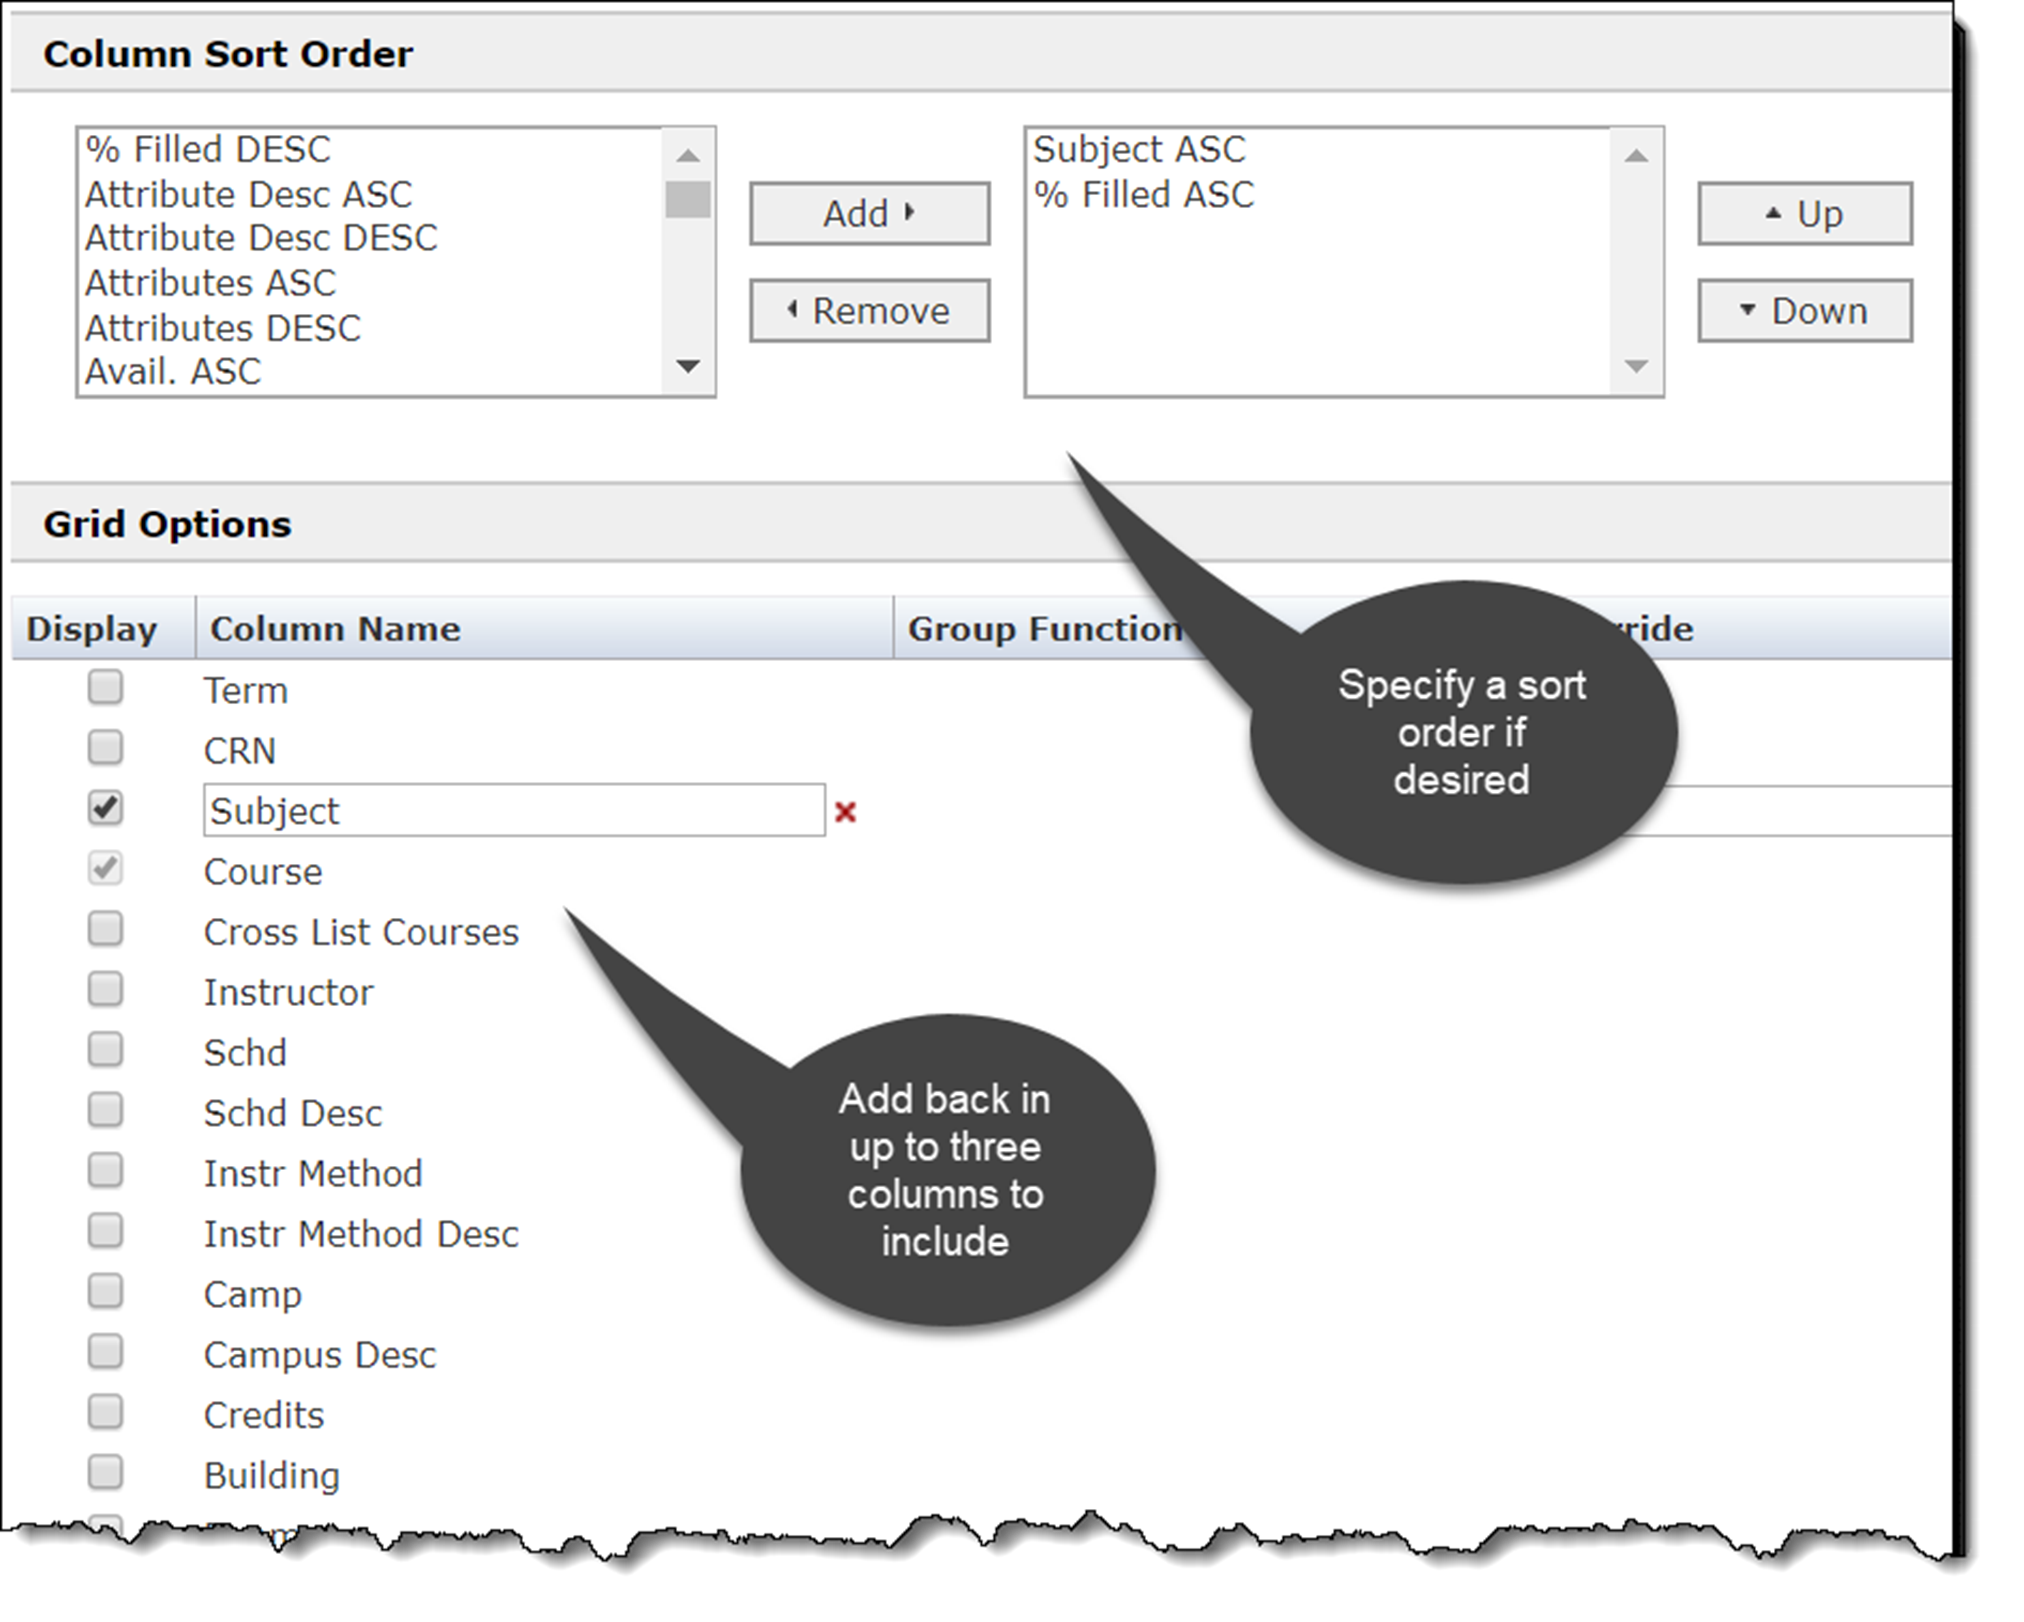
In the Grid display, check off each column name that you wish to display (up to 3 columns)
You can also assign a Column Sort Order in the drop-down area above the Grid Options
11. Click on Execute Report.
below is a sample report that will result from the above cross tab report.