Using Group Functions to Summarize Data
On any FAST report, locate the Advanced Options Tab (which may be in the + More Tab)
Under Grid Options, one of the available fields is called Group Functions.
In the Display column, clear the check boxes for the columns you do not want to see. You can also click Select No Columns and then select the check boxes for the columns you want to add back in.
For the field you want to summarize the data for, select one of the following from the Group Function list from the drop-down option. Please note that not every option is available on every column; FAST will provide the best options based on the data type in that field.
-
Gender grouped by Class Code

Count (and Display)Count (and Display)
Gender Count (and Display) grouped by Class
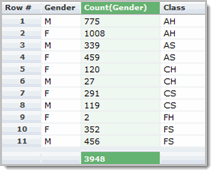
-
Youngest employee (DOB=Maximum) grouped by Class code and Gender

-
Oldest employee (DOB=Minimum) grouped by Class Code and Gender

-
Average Accrued hours grouped by Leave and Class code
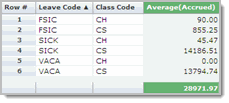
-
Total (Sum) Enrolled grouped by Term and CRN
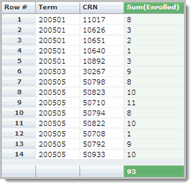
-
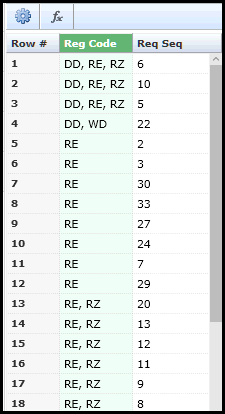
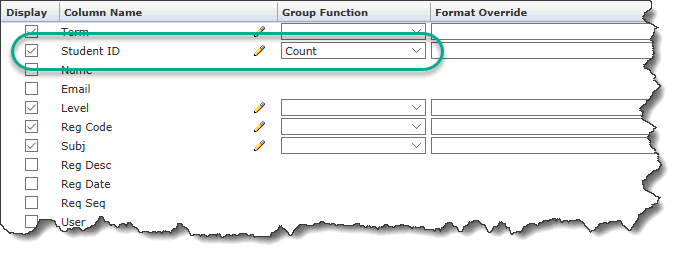
This example uses the Count function for Student ID:
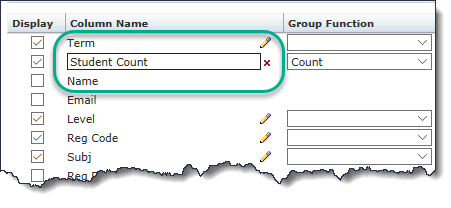
You could also then choose to re-name the column to better align with the dataset. In this example, you could re-name the column from Student ID to Student Count. To re-name the column, Click the Edit Pencil and type in your column name. If you change your mind, click the red X to discard:
Click Execute Report.
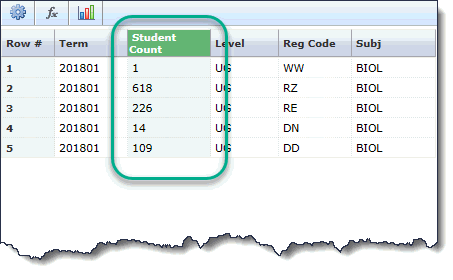
The report will display only your selected columns and will now COUNT rather than list the Student ID's. Notice the column title has also been updated for your report only. Also notice that your total record count of 968 has been limited to a total of 5.

You can now do any of the following:
To display the full report and remove your changes: Click Clear Advanced Options and then Execute Report.
To discard your changes: simply leave the page without saving
To save your report options: Click Save as to create a Pinned Report.
To create a graph, click the Graph Icon on the toolbar.
