Managing Dashboard Layout
Once one or more Dashboards have been created, and a variety of charts and graphs have been added to those Dashboards, you're ready to understand how to properly manage those Dashboards for the most effective use!
There are two modes of Dashboard Management that we're going to cover in this section:
Managing my own Dashboards
Managing Dashboards for Groups
These functions are done in exactly the same way, however the net impact will be different. A Private Dashboard is one that only you can see, edit or delete whereas a Group Dashboard is one that will be available for the members of the Groups that have been assigned to view it. We're going to discuss the security settings in a section called Sharing Dashboards.
Managing Dashboard Layout
To manage your own (private) Dashboard, first you should select the Dashboard within the application you're currently managing. Remember the Dashboards are listed in a tabular format, so just click on the one you'd like to take a look at for editing.

Once you've selected your Dashboard, you're ready to enter the Edit Mode. To do this, simply click the Edit Design button.

Once in Edit Mode, there are a few things we can do!
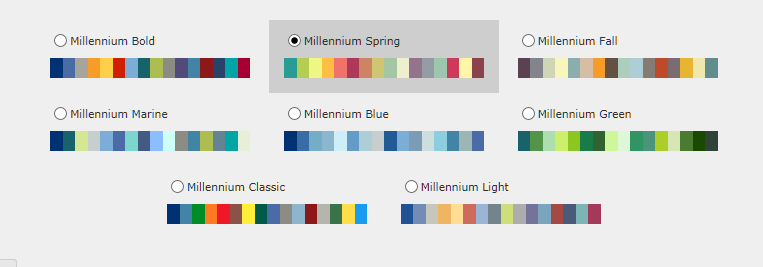
To change the Theme or Palette of this Dashboard, click on the Themes Button:

A list of pre-defined options will display for you to choose from! These options are configured by the Administrators and may be customized at the Admin level. Once you choose a Theme (or Color Palette), it will be applied to the contents of the entire Dashboard, not to a single Graph:
To re-arrange or re-configure your Dashboard, simply use standard drag & drop functionality. You can move graphs around on the Dashboard or you can re-size any graph by simply dragging the side or base bar in or out.
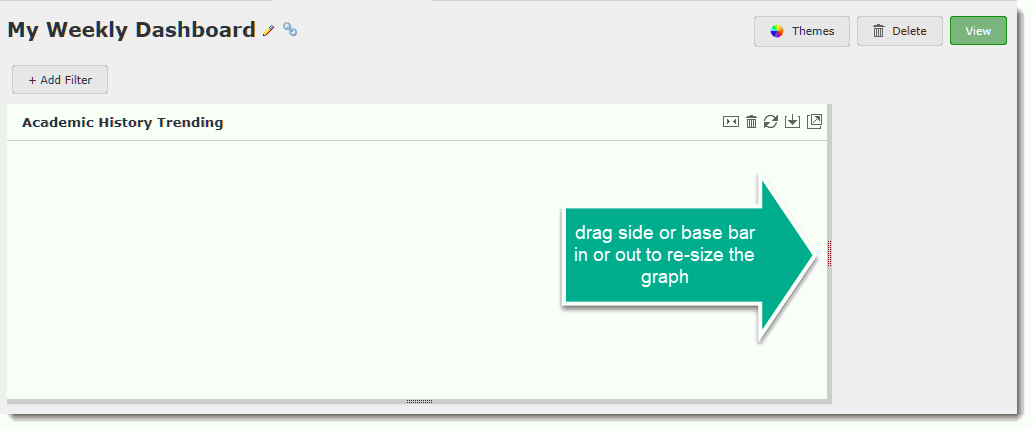
Alternatively, you can also use the pre-formatted toolbar with a few popular options (hover over each item to view the pop-up description):

Shrink Horizontally: Will automatically shrink the graph to half the size of the Dashboard and auto-fit the contents
Delete: Remove Graph from Dashboard (this will not delete the Pinned Report or the Graph, rather it will be removed from this Dashboard)
Refresh: Click Refresh to refresh the Graph
Export Graph to PDF
Popout Graph: This allows you to view the graph as a full-screen image
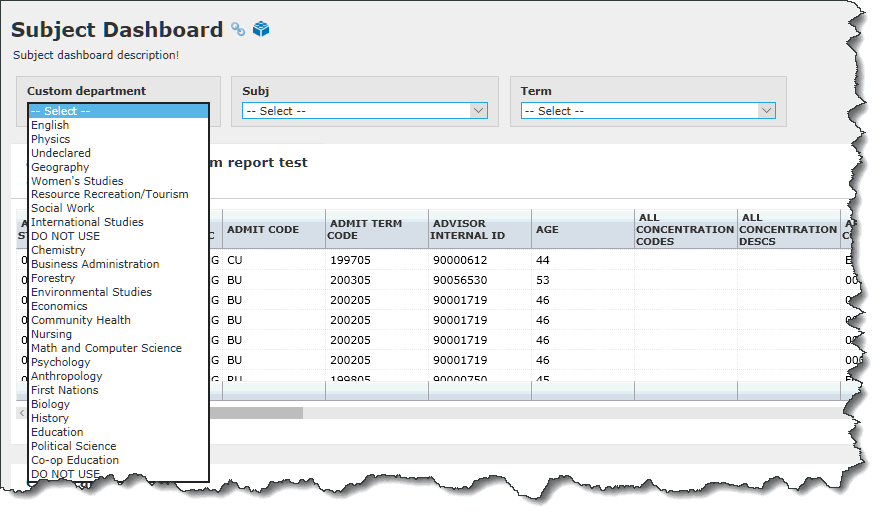
To add additional Graphs to the same Dashboard, simply locate the title of the Graph (or Grid) on the list of available Dashboard Items on the left hand pane. These are divided into two categories: Private and Group. If you see something that looks interesting, just drag & drop it to the placement on the Dashboard where you would like it to be. You can always re-arrange and re-size later! It will auto-fit to the space once you let go.
To add a Filter to your Dashboard, please review the section on Dashboard Filters. This is a more advanced topic and we have included a section devoted to this topic. Once your Filters have been added, you can drag and drop them to place them in your preferred order.
If Dashboard Filters have already been added by a Dashboard Administrator, you can apply them now to review your Graphing data summarized by the Value(s) in the Filter.
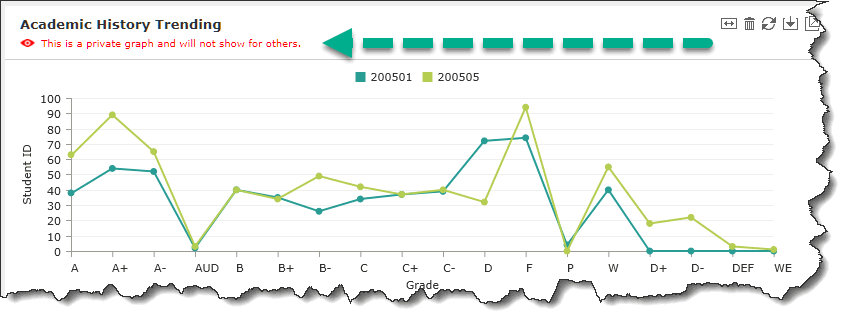
You are able to also add Private Graphs to Group Dashboards that you have access to; this might be a nice way to summarize certain items that you would like to see in one place, without the need to create a whole new (Private) Dashboard. It's important to remember that adding a Private Graph to a Group Dashboard does not mean that other members of that Group will see it. In fact, when a Graph or Grid is Private, you are the only person who can see it. When you drag and drop a Private Graph to a Group Dashboard, you will see the following message, while in Edit Mode only:
An important note for those of you managing Group Dashboards: Managing Group Dashboards is exactly the same as managing Private Dashboards with one key exception - only certain users will be able to view those Dashboards and the contents on them. To better understand Sharing Options, please review the section called Sharing Dashboards.
To edit the Title, security or Description of your Dashboard, click the Edit Pencil next to the Dashboard Title:
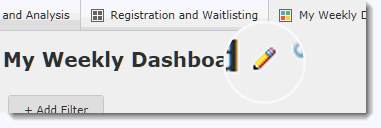
This will open an Edit Pane where you can edit any of the following:
Dashboard Name
Dashboard Description
Users who can View this Dashboard
Users who can Edit this Dashboard (Note: this is reserved for users in Groups who also have the Dashboard Administrator Role)

Click Save to commit your changes or Cancel to discard.
