Custom column filters
After you run your report, you can click a column title to use the custom filters. With this tool, you can limit the amount of items on the page by filtering on a specific column, sort a column in ascending or descending order, select columns as the X or Y axis for a graph, or hide any column in the report.
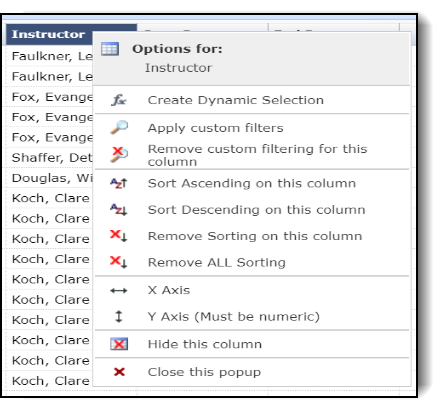
Click one of the following for detailed instructions:
Filtering by columnFiltering by column
Click a column title.
Click Apply custom filters
 .
The Custom Column Filtering dialog box opens.
.
The Custom Column Filtering dialog box opens.Select an item from the list.
There are different drop-down lists depending on the type of data in the column: Text, Numeric, and Date.
In the text box—depending on the type of dialog box—do one of the following:
Text dialog box
Type a string using the wildcard (%), for example:
Grad%: Starting with Grad.
%proposal: Ending with proposal.
%Research%: Research anywhere.
Numeric dialog box
Type a number.
Date dialog box
Add the date using one of these options:
Click the calendar.
Type it in this format: dd/mm/yy.
Click Apply Filters. Records matching the filter criteria open.
You can do one of the following:
Repeat Steps 2 to 5 to filter your report further.
Click the column heading and then click
 to Remove custom filtering for
this column.
to Remove custom filtering for
this column.
Sorting by columnsSorting by columns
Click a column title.
Click one of the following:
 Sort Ascending.
 Sort Descending.
An up or down arrow displays beside the column title.
Click the column heading and then
 to Remove Sorting for the column.
Selecting columns for your graphSelecting columns for your graph
Click the column title you are using for your X Axis and click
 .
The symbol displays next to the title.
.
The symbol displays next to the title.Click the column title you are using for your Y Axis (must be numeric) and click
 . The symbol displays next to the title.
Hiding and showing columnsHiding and showing columns
Click a column title.
Click
 to Hide
this column.
to Hide
this column.To show the column, click the Report Options tool bar and then Advanced Options.
Under Display, select the check box for the column.
Click Execute Report.
Column Level Filters:
When applying custom column-level filters, you have the ability to refine data your report will display that cannot necessarily be limited using Filter Options; these are conditions you may wish to apply on the column-level data rather than at the report level. Do apply a column level filter, click on the Column Header (title bar) and select Apply Custom Filters: