Using Subtotals to Group Report Results
The Advanced Option of Subtotals has been added to the Advanced Options Tab to allow users to group the report results visually by up to three fields (columns) in the report. This is an option that allows users to change the report flow and format while maintaining the integrity of the original report.
The Site Administrators will determine the maximum number of records that will be able to be sub-totaled. This is set up using Configuration Setting 610. Please note that the larger that number is set to, the slower the report may run, but users will be able to generate larger datasets using the sub-totaling option.
To use the Sub-totaling option, after running a FAST report, select the Advanced Options Tab and locate the Sub-totaling Fields option (you may have to expand this option on the page):
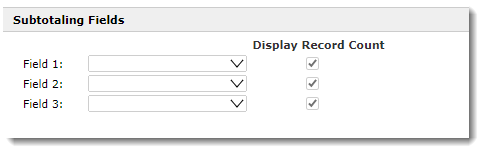
The users can include up to three levels of subtotals in each report where this function is available. Please note the by increasing the number of fields, the speed of the report results can decrease (depending on the total number of records on the original report).
If you use the "Display Record Count" option, the record count for each sub-totaled level will also display.
Here is an example of how Subtotals may be used to refine report data and group by category:
-
In this sample, I ran a Foundation report; once the report runs, click on the Advanced Options Tab;
-
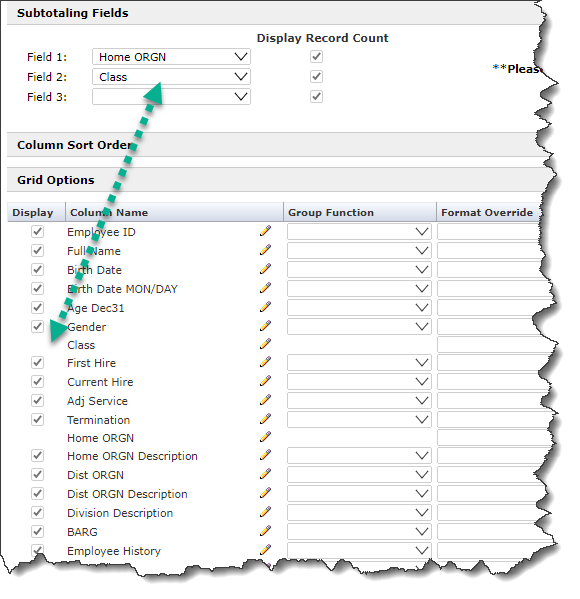
Add between one and three fields to use in the Subtotal Advanced Options:

-
You will notice that each of the fields selected are no longer available to Group, and Cross Tabs and Unique Records are also disabled once the Sub-totaling option has been enabled, these panes will collapse and/or be removed from the Grid Options. Additionally, the selected fields will no longer be available to remove from your Grid Options, as shown:
-
You can also, at any time, remove additional values (columns) from the report by clicking the Display indicator next to the Column Header. You can also re-arrange columns and/or Sort columns in any number of ways before moving on. These are fully explained in the Grid Options.
-
When you're ready to review the revised report details, click Execute Report; remember that depending on the total number of records generated, adding multiple layers of sub-totaling can cause the report run slower. Be patient.
-
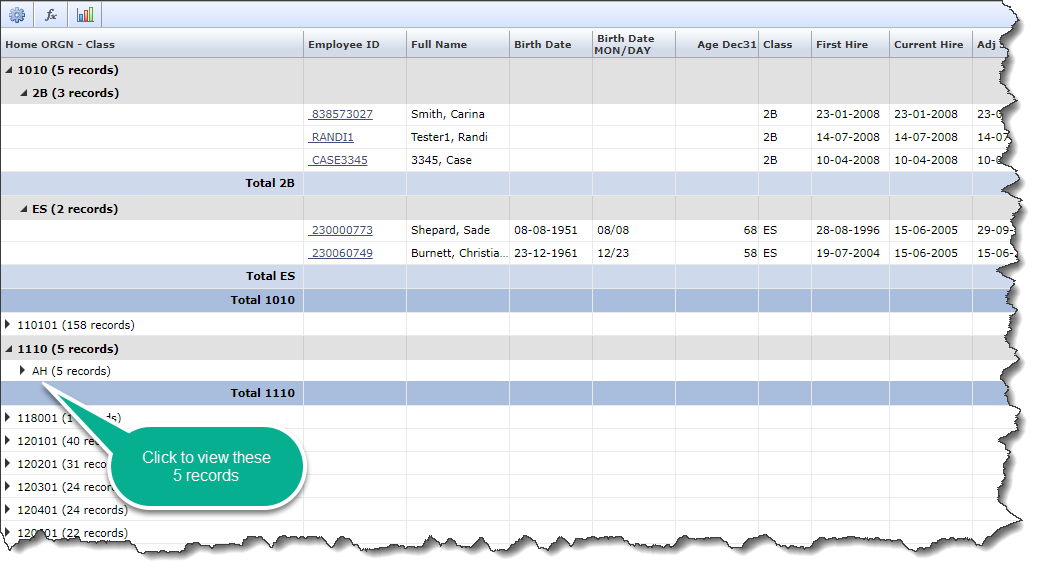
When the report executes, the results will be collapsed; just click on any parent to expand that node and see the detailed records that it contains. In this example, I have opted to view the record count.
-
You can now review the report detail by sub-totaled field. Each level can be opened (expanded) by clicking on the triangle. Each "parent" (top level) will open to show the contents which could include the report detail or another layer of sub-totals.
-
To review the entire dataset expanded (without having to expand each section manually), just use the Export to Excel button or the Export to PDF button on the bottom of the page.
Your report is now ready to be saved as a Pinned Report or you can continue to make edits using the Advanced Options or report level functionality.