How to create a report
This example explains how to create an Exam Summary report in the Student Reporting application. The same procedure applies for most reporting pages within the application. The menu items that you see are based on your security roles within the Student Reporting application.
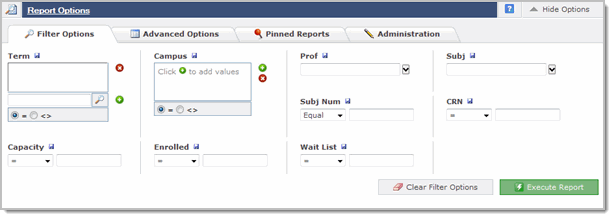
On the Course Info menu, click Exam Summary. The filter options open.

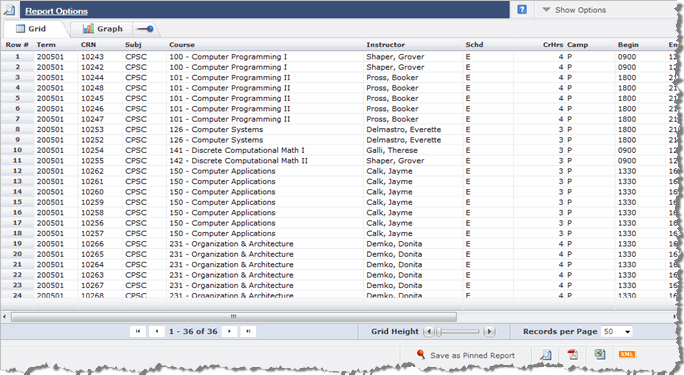
Select at least one filter option and click Execute Report. The datagrid lists the records in your report based on the selected filter options.

You can use any of the following tools:
Click the Report Options toolbar (or the Show Options button) to open the Filter Options, Advanced Options, Pinned Reports., and Administration tabs.
Click
 to open context-sensitive help and read
page specific notes.
to open context-sensitive help and read
page specific notes.Click the Graph tab to create and view your data in bar, line, or pie chart format.
Use the Custom column filters to filter, sort by, select X or Y axis for graphs, or hide/show column headings.
Drill-down for information related to the record by clicking a blue hyperlink and then return
 to the
previous page.
to the
previous page.Change the way you display records in a report.
Save as a pinned report.
Export the data into a PDF
 .
.Export the data into Excel
 .
.Export the data in XML
 format.
Attach file to student record. (Available on the Student Personal Information.)
|
|
